Why Space Maps Need More Than a Point of View
Why space maps need more than a point of view: learn to read projections, frames and labels so comparisons reveal what a map can—and cannot—show.
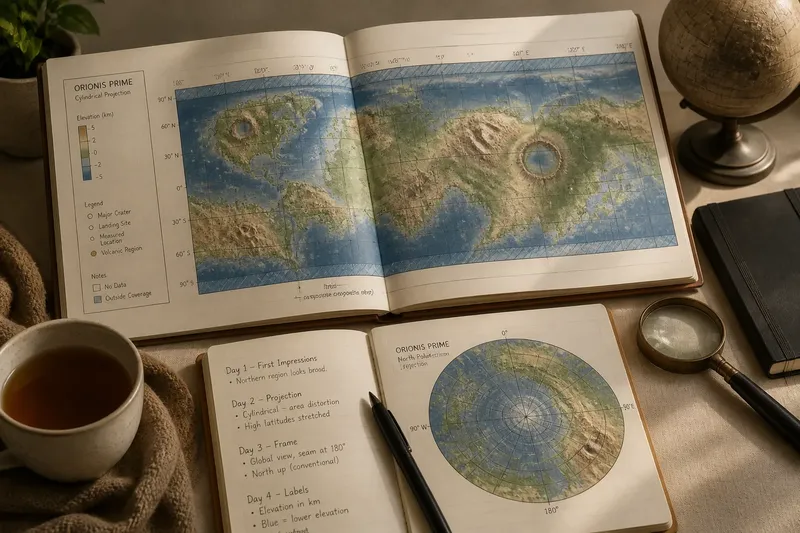
You open a planetary map beside a cup of tea and notice that one hemisphere looks enormous while a neighbouring region seems squeezed towards the edge. Before deciding that the planet is oddly shaped, pause over the map itself. Why space maps need more than a point of view becomes clear when you read the projection, frame and labels as part of the image, not as decoration.
A map turns a three-dimensional world, or a sky full of objects, into a flat picture. That translation affects what can be compared: area, shape, distance and direction do not all survive unchanged in every projection. A simple week-long reading routine can help you spot what a particular map makes easy to see and what it asks you to treat cautiously.
What should you notice on the first day?
Choose one map and record its title, the body or region it shows, and the question you hope it can answer. Is it meant to show a whole planet, a polar region, a star field or a route? A map designed for navigation has different priorities from one made to compare surface features.
Then locate the map’s edges. A rectangular world map may cut a globe into a strip and join its left and right margins; a circular map may place a pole at the centre. Look for boundary lines, blank areas and any indication of what lies beyond the frame. The boundary is a viewing decision, not necessarily a physical edge in space.
Write down one first impression in plain language, such as “the northern region looks broad”. Keep it as an observation about appearance, not yet a claim about actual area. That small distinction will make the rest of the week more useful.
How does the projection change what you can compare?
On the second day, find the projection name or description, often in a caption, legend or map credit. A projection is the method used to represent a curved surface on a flat page or screen. Some preserve local angles and familiar outlines while stretching area; others make area comparisons more faithful but alter shapes. No single flat projection preserves every property everywhere.
For a planet shown from pole to pole, a cylindrical projection can make high-latitude regions appear broader than they are relative to places near the equator. A polar projection makes the area around one pole easier to inspect, but distances and directions shift as you move away from the centre. These are not errors by themselves. They are trade-offs that matter differently depending on your question.
Try a paired reading: compare two maps of the same body, first checking whether they cover the same area and use the same scale or projection. If a feature looks larger in one, do not infer that it is physically larger until you have checked how each map represents the surface. If no projection is named, mark that uncertainty rather than guessing.
What can the frame tell you?
On the third day, inspect the frame and its orientation. A north arrow, coordinate grid or labelled pole can tell you how the image is aligned. In space imagery, “up” may be chosen for clarity or to match a viewing geometry; it need not correspond to the direction you expect from a familiar globe. A rotated map can still be accurate, but it changes how quickly a reader recognises landmarks.
Check whether the frame includes the full object or only a selected region. A cropped view can make a crater, ring or cloud band feel central simply because the surrounding context has been removed. Notice also whether the map wraps around: at a seam, a continuous feature may appear split between opposite edges.
Say you are comparing two invented maps of the same fictional moon. One shows its entire surface in a rectangle, with a seam running through a long valley; the other centres on the valley in a circular polar view. The valley may seem broken on the first and dominant on the second. Checking the frames and their coordinates would show that the difference comes from coverage and orientation, not from two different valleys.
Which labels help you read the image?
On the fourth day, read the legend before interpreting colour. A blue patch might represent a material, elevation, temperature, an observation category or simply a chosen visual convention. Find the scale bar, unit labels and key, then ask whether colours describe continuous values or separate categories. A smooth gradient and a set of sharply distinct colour blocks make different kinds of claims.
Next, inspect coordinate labels and feature names. Latitude and longitude lines can locate a place, while a grid may use another reference system suited to a particular body. Check what the legend says about symbols: a dot might mark a landing site, a named feature or a measurement location. Without that key, its meaning is only a guess.
Pay attention to confidence or coverage marks, too. A blank patch might mean no data, an area outside the map’s scope or a surface category assigned a pale colour. Captions and notes often distinguish these possibilities. If they do not, describe the blank as “unlabelled” rather than treating it as a definite absence.
What questions should you ask before comparing maps?
Can two maps be compared if their projections differ?
Yes, but first decide which property matters and check how each projection handles it. For a rough visual comparison, note the difference; for a claim about area or distance, seek a map suited to that property.
Does a larger-looking feature mean it is larger in space?
Not necessarily, because projection, crop and scale can all affect its apparent size. Check the legend and coverage before treating appearance as a measurement.
Why do map edges sometimes split a feature?
A global map must place a join somewhere when a curved surface is flattened. Look at the coordinates and opposite margins to see whether the pieces continue across the seam.
What should you do if the map gives no projection?
Use it cautiously for broad orientation and avoid precise comparisons that depend on area, shape or distance. Record the missing information so another reader can distinguish the map’s appearance from a stronger claim.
How can you finish the week with a fair comparison?
On the fifth day, revisit your first impression and rewrite it with the map’s choices in view. Instead of “this region is huge”, you might write “this region appears broad in this cylindrical view; the projection affects area near the pole”. That sentence keeps the observation while making its limits visible.
On the sixth day, compare the map with a second source, preferably one that states its projection, coverage and legend clearly. You do not need a stack of maps. One useful counterpart can reveal whether a striking shape or colour is tied to the original map’s design.
On the seventh day, make a short reading note with four points: the map’s purpose, its projection if given, its frame and orientation, and the labels that control interpretation. Add the question it can answer well, then one question it cannot settle on its own.
There is little value in trying to identify every technical projection from the outline alone, or in treating a familiar-looking map as neutral. The practical habit is simpler: name what you see, check the frame and key, and match your comparison to what the map preserves. Why space maps need more than a point of view is not a demand for specialist knowledge; it is a reminder that every view comes with choices the reader can learn to see.